
Competition on Harvesting Raw Tables from Infographics
Summary
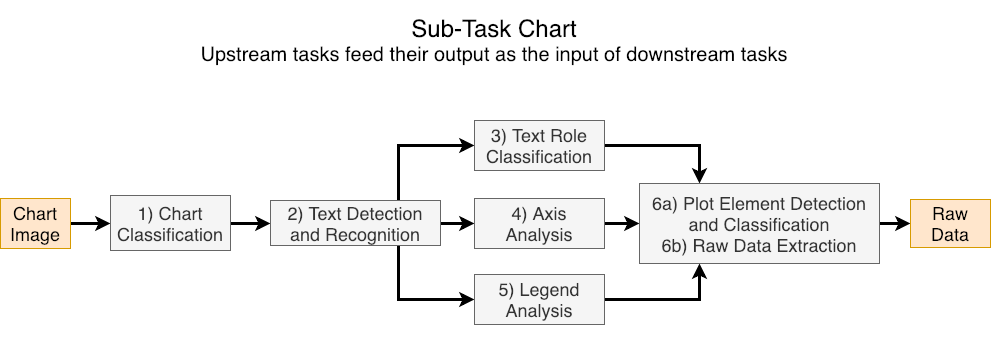
This competition is composed of a series of 6 sub-tasks for chart data extraction, which when put together as a pipeline go from an input chart image to a CSV file representing the data used to create the chart. Entrants in the competition may choose to participate in any number of sub-tasks, which are evaluated in isolation, such that solving previous sub-tasks is not necessary. We hope that such decomposition of the problem of chart data extraction will draw broad participation from the Document Analysis and Recognition (DAR) community. Additionally, we also evaluate methods that perform the whole chart data extraction pipeline from the chart image without receiving intermediate inputs.
Competition Updates
| Nov 3 | Training & Testing sets are publicly available. |
| May 23 | Leaderboards is out. |
| May 9 | Testing dataset is released. |
| Feb 23 | Training dataset is released. Download |
| Feb 21 | Registration is now open! |
| Feb 20 | Previous CHART-Info links: ICDAR2019, ICPR2020 |
Background
Charts are a compact method of displaying and comparing data. In scientific publications, charts and graphs are often used to to summarize results, comparison of methodologies, emphasize the reasoning behind key aspects of the scientific process, and justification of design choices, to name a few. Automatically extracting data from charts is a key step in understanding the intent behind a chart which could lead to a better understanding of the document itself.
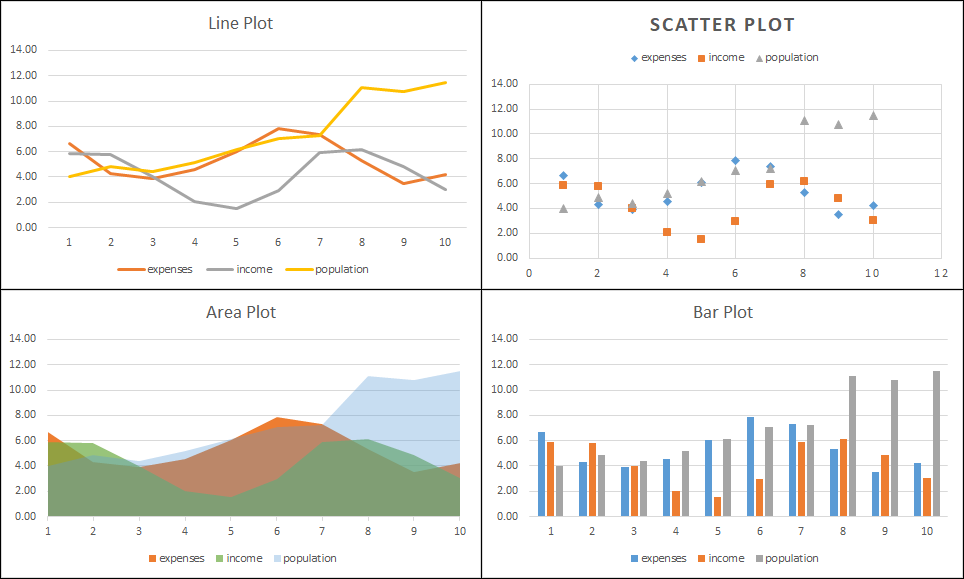
Example chart types to use in the proposed competition. Note that all these were generated from the same tabular data.
The DAR community has displayed a continued interest in classifying types of charts as well as processing charts to extract data. In the past decade, multiple applications have been built around automatic processing of charts such as retrieval, textual summarization of charts, making charts more accessible on the web, automatically redesigning charts, automatically assessing chart quality, preservation of charts from historical documents, chart data plagiarism detection, bibliometrics, visual question answering and accelerating discovery of new materials.
Prior competitions related to this area include DeTEXT which concentrated on detecting text in figures and ImageCLEF competition on medical compound figure separation and multi-label classification. However, these competitions do not concentrate on end-to-end data extraction from scientific charts, but include these as a sub-type of scientific figures in general.
Competition Outline
Dataset
Our previous competitions used both real and synthetic charts datasets for all tasks. For ICPR 2022, we are providing a extended UB PMC dataset, which contains real charts extracted from Open-Access publications found in the PubMedCentral. (PMC). Following the same protocol, we only picked images released under a Creative Commons By Attribution license (CC-BY), which allows us to redistribute them to the competition participants.
For this competition, UB PMC has a new, larger training set (by merging training and testing sets from previous competition), and a novel testing set that is also collected and annotated on real charts. Participants can use additional datasets (e.g. Adobe Synth from previous competition) to improve the performance of their framework, as long as it is notified in their final result.
Evaluation
On May 1st, 2022, we will release the test datasets, and by May 8th competition participants are expected submit the following:
- Predictions on each test dataset
- A short system description
The organizers will tabulate the results for each subtask for each dataset and present it at ICPR 2022 in Montréal Québec, Canada . Note that you do not need to attend ICPR 2022 to participate in this competition.
The sub-tasks considered in this competition are
- Chart Image Classification (e.g. bar, box, line)
- Text Detection and Recognition
- Text Role Classification (e.g. title, x-axis label)
- Axis Analysis
- Legend Analysis
-
Data Extraction
- Plot Element Detection/Classification
- Raw Data Extraction
Each subtask is evaluated in isolation, meaning that systems have access to the ideal output (i.e. Ground Truth) of previous subtasks. Subtasks 3-5 are considered parallel tasks and only receive the outputs of subtasks 1 and 2. For example, the input for the Axis Analysis sub-task is the chart image, chart type, text bounding boxes, and text transcriptions. Each sub-task has its own evaluaton metric, detailed on the Tasks page.
Participants are not obligated to perform all subtasks or all datasets and may submit test results for any set of subtasks or datasets they wish. Additionally, methods may be submitted for the complete data extraction task where systems are only given the chart image (no intermediate inputs) and are expected to produce the raw data used to produce the chart (same output as subtask 6b).
Registration
Register here.
Acknowledgements
The creation of our manually curated real CHART dataset was partially supported by the National Science Foundation under Grant No.1640867 (OAC/DMR).