Competition Tasks
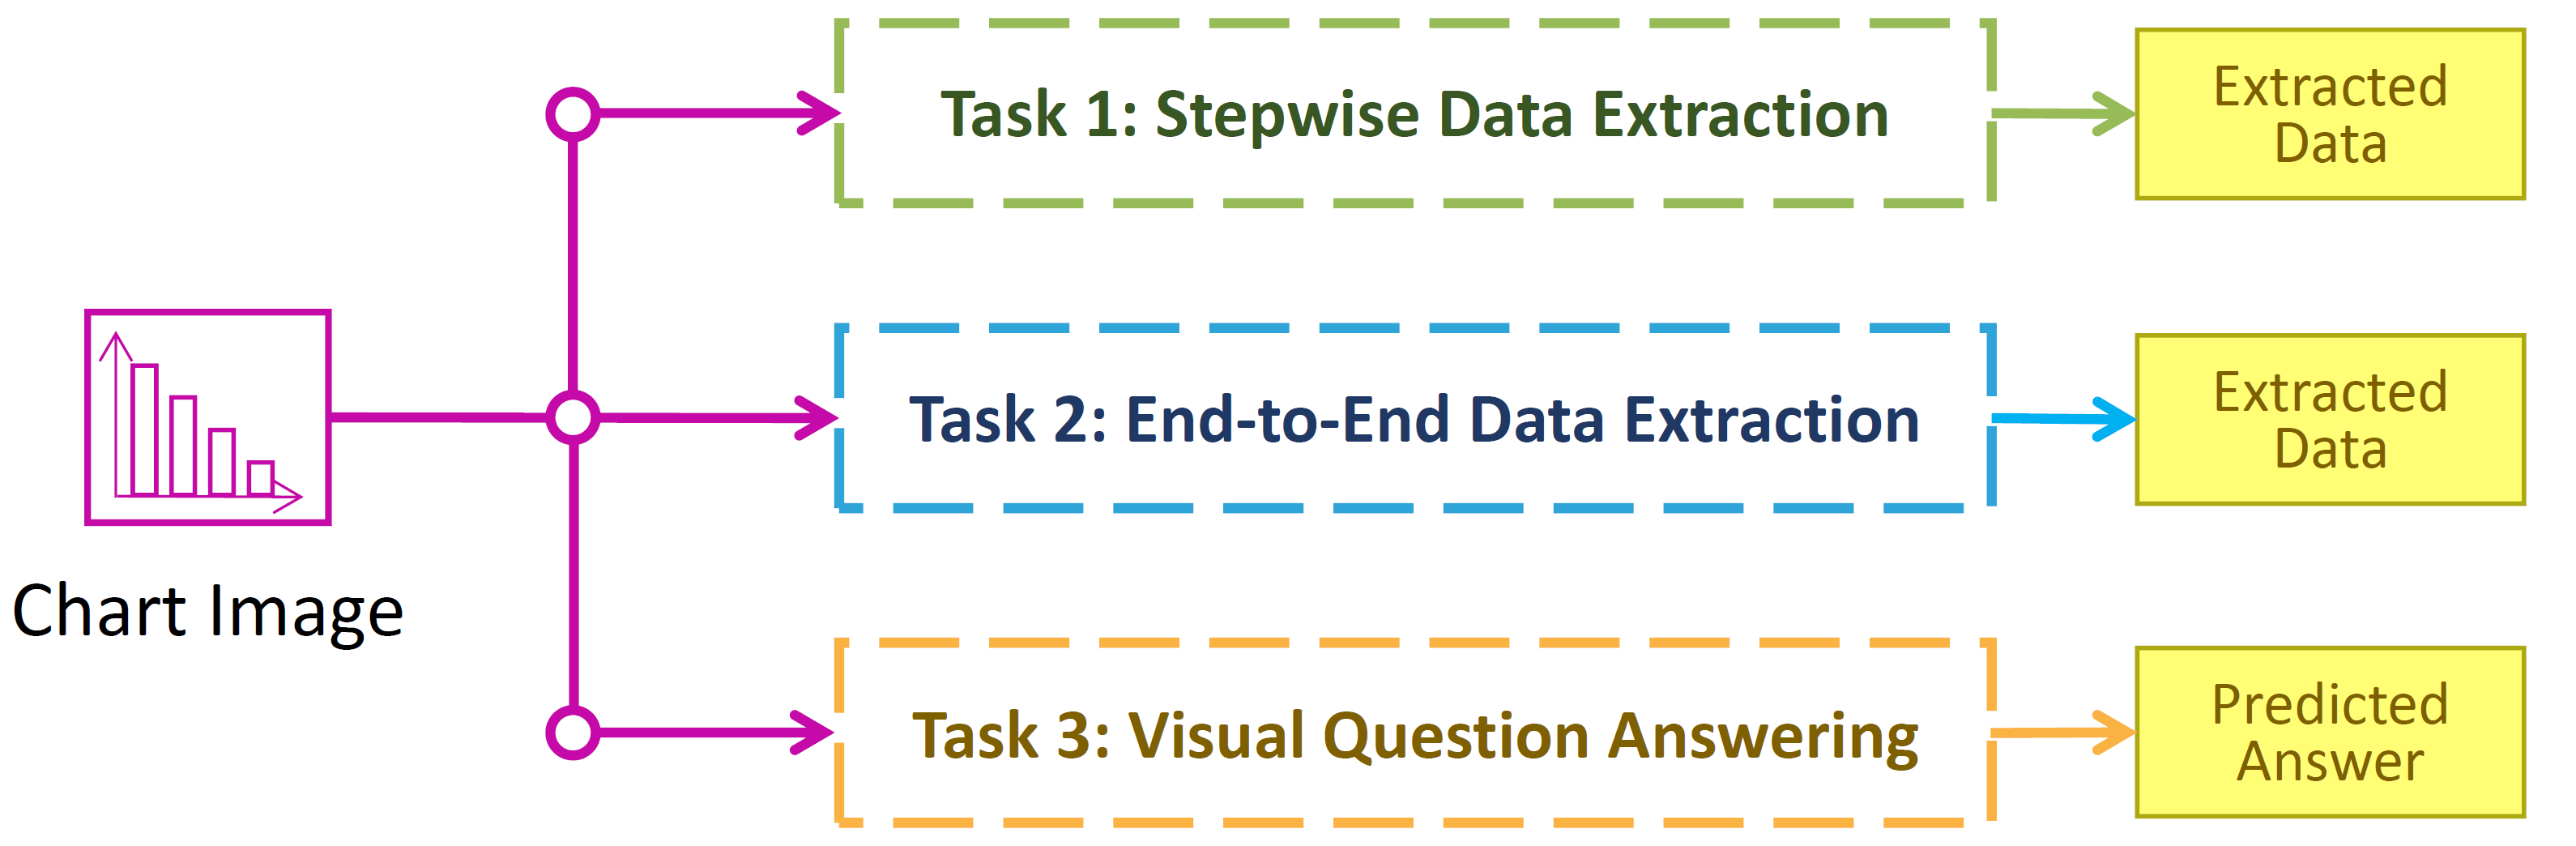
The main task of the competition is to, given a chart image, extract the raw data that was used to create the chart image. Given the complexity of the data extraction task, we consider two versions: Stepwise (Task 1) and End-to-end (Task 2). In addition, this year we are providing a new additional task on visual question answering based on charts (Task 3).
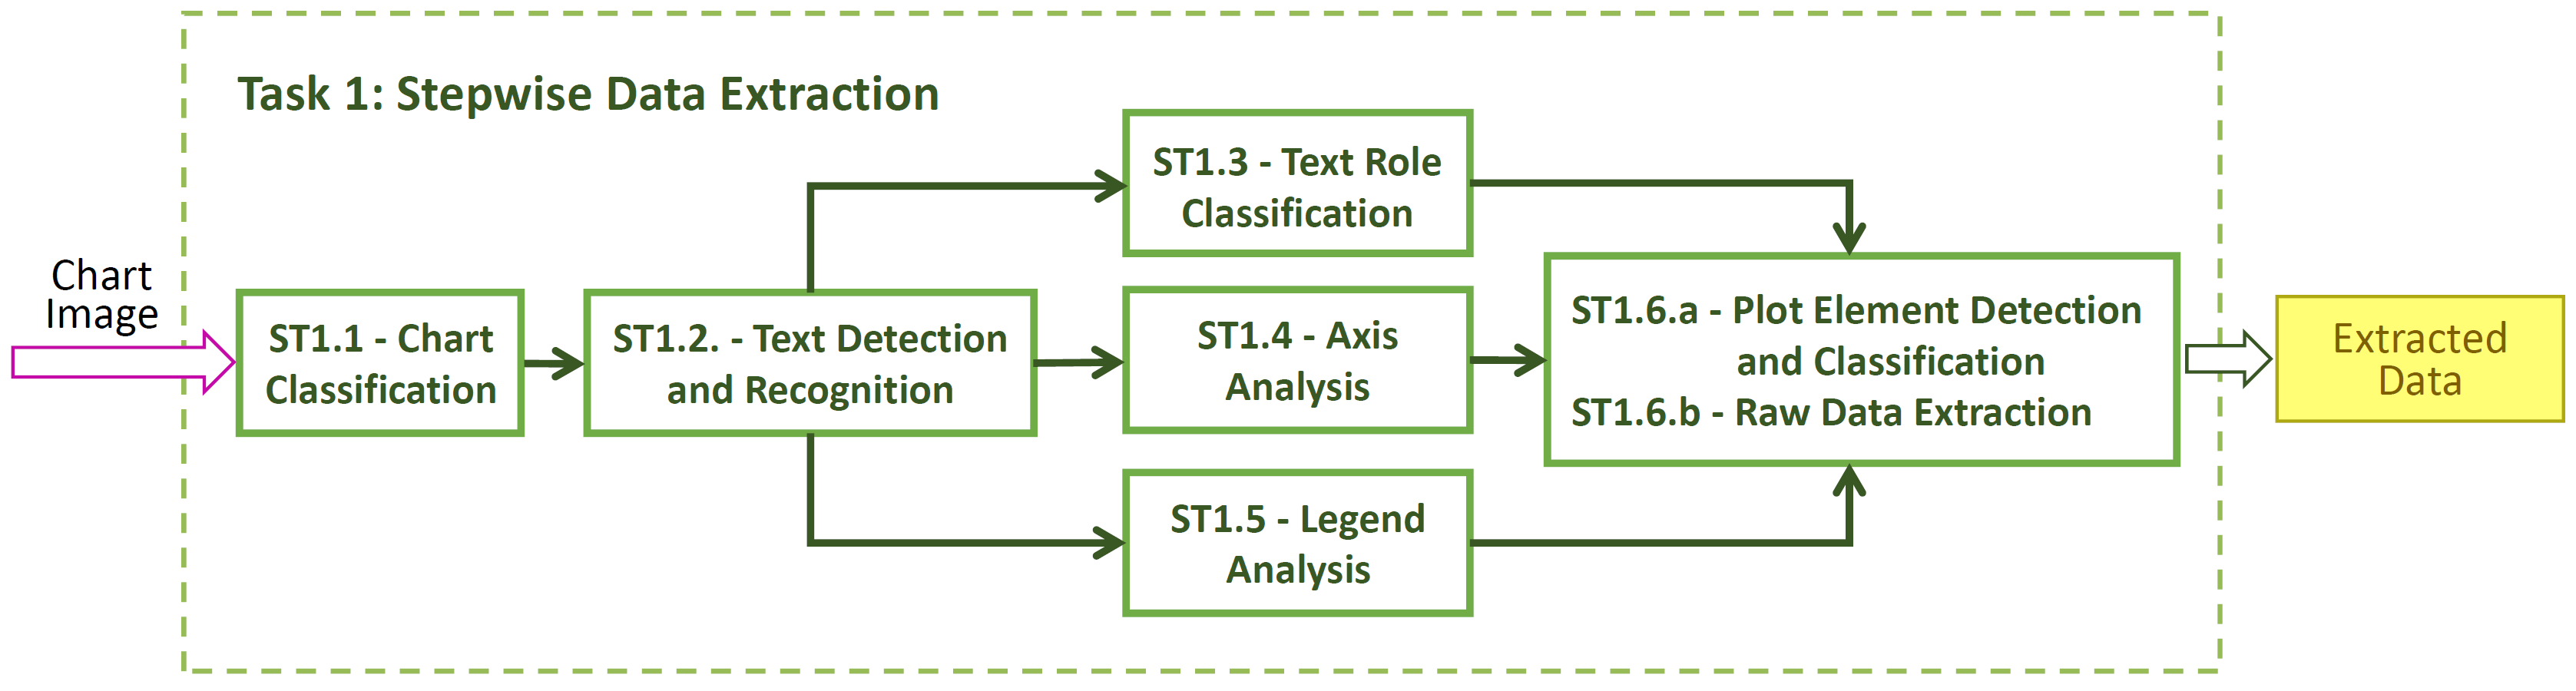
We acknowledge that building an entire chart processing pipeline is time consuming, so to encourage participation from the wider community, we divide the overall task into several smaller sub-tasks that can be solved in isolation. For each sub-task, the ground truth (GT) outputs of some previous sub-tasks are provided as input. Researchers are encouraged to participate in as many or few sub-tasks as they like. However, we also evaluate systems that perform the entire pipeline of sub-tasks without intermediate inputs.
Note that since some partial ground truth will be provided for task with dependencies, disjoint subsets of the test set will be used to evaluate these tasks independently for fairness. For all tasks, the chart image is provided. Below you can find the details of each task and subtask.
- 1.1 Chart Classification
- 1.2 Text Detection/Recognition
- 1.3 Text Role Classification
- 1.4 Axis Analysis
- 1.5 Legend Analysis
- 1.6 Data Extraction
- 2 End-to-End Data Extraction
- 3 Visual Question Answering
Task 1 - Subtask 1.1 - Chart Image Classification
Knowing the type of chart greatly affects what processing needs to be done. Thus, the first sub-task is to classify chart images by type. Given the chart image, methods are expected to output the chart class. We are providing the UB-UNITEC PMC dataset that has a set of classes as follows.
Classes of Chart Images on UB PMC Datasets
Area
Heatmap
Horizontal Bar
Horizontal Interval
Line
Manhattan
Map
Pie
Scatter
Scatter-Line
Surface
Venn
Vertical Bar
Vertical Box
Vertical Interval
Note that many classes included in this subtask such as pie and donut plots are not used for the remaining sub-tasks.
Metric
The evaluation metric will be the average per-class F-measure. Based on the class confusion matrix, we can compute the precision, recall, and F-measure for each class. The overall score is the average of each classes' F-measure.
To account for charts with multiple possible labels (i.e. single data series bar charts), the per-class precision and recall is modified to not penalize ambiguous cases.
Input/Output
Input: Chart Image
Output: Chart Class
Task 1 - Subtask 1.2 - Text Detection/Recognition
Understanding the text in charts is necessary to interpret the graphical elements correctly. This sub-task concentrates on detecting and recognizing the text within the chart image. Competing systems are expected to produce tight bounding boxes and transcriptions for each text block. Examples of individual text blocks individual titles, tick labels, legend labels. Text blocks may be a single line, multiple lines (due to text wrapping), and may be horizontal, vertical, or rotated.
A predicted bounding box matches a GT bounding box if their Intersection Over Union (IOU) is at least 0.5, and tighter IOU criteria will be used to resolve ties when multiple predictions can match a single GT bounding box.
Metric
There are two evalaution metrics for detection and recognition respectively. For detection, we will sum the per-block IOU and divide by max(#predicted, #GT) for each image. For recognition, we will average normalized Character Error Rate (CER) for each text block in an image. By normalized CER, we mean that the number of character edits to transform a predicted word to GT word is divided by the length of the GT block. False positive and false negative text block detections will be assigned a normalized CER of 1 and an IOU of 0. We will use the same procedure as the ICDAR Robust Reading Competitions to handle split/merged boxes.
For each chart, we will compute both detection and recognition scores. Then we will average the per-chart scores over the whole dataset to ensure that each image contributes equally to the final score. The winner for the sub-task will be determined by the system with the highest harmonic mean of detection and recognition scores.
Input/Output
Input: Chart Image, Chart Class
Output: List of (Text Block BBs, Text Transcription)
Task 1 - Subtask 1.3 - Text Role Classification
For text to be useful in chart interpretation, its semantic role should be identified. This sub-task focuses on identifying the role of each text block in a chart image, and text bounding boxes and transcripts are provided as input. Competing systems are expected to classify each bounding box into one of the following roles.
Chart Title
Axis Title
Tick Label (x and y axes values)
Tick Grouping (x and y axes)
Legend Title
Legend Label
Value Label
Data Marker Label
Other
Metric
Similar to the evaluation in sub-task 1 (chart classification), the evaluation metric will be the average per-class F-measure.
Input/Output
Input: Chart Image, Chart Class, List of (Text Block BB, Text Transcription, Text Block Id)
Output: List of (Text Block Id, Text role)
Task 1 - Subtask 1.4 - Axis Analysis
Locating and interpreting the axes of the chart is critical to transforming data point coordinates from units of pixels to the semantic units. Competing systems are expected to output the location and value of each tick mark on both the X-axis and Y-axis. Tick locations are represented as points and must be associated with the corresponding value (a string). Note that some sets of ticks are ordered or unordered discrete sets with textual non-numeric labels.
For this competition, X-axis will always refer to the axis that represents the independent variable shown, rather than the axis that is visually horizontal. For example, horizontal bar and horizontal box plots have an X-axis that is vertical. Similarly, the Y-axis is not always the axis that is vertical.
Metric
We use a modified F-measure to score each axis and then take the average F-measure over all axes. Each detected tick is scored for correctness, receiving a score between 0 and 1. Precision is then computed as the sum of the scores divided by the number of predictions. Recall is computed as the sum of the scores divided by the number of ground truth ticks.
A detected tick receives a score of 1 if the predicted point is close to the corresponding GT tick point, where correspondance between predictioned and GT ticks is based on the text BB and transcription. The threshold for close (scoring 1) and the threshold for far (scoring 0) is based on the distance between tick marks in the chart image. Predictions that are between the close and far thresholds are penalized linearly with distance.
Input/Output
Input: Chart Image, Chart Class, List of (Text Block BB, Text Transcription, Text Block Id)
Output: For each of X-axis and Y-axis, List of tuples (tick x position, tick y position, Text Block Id)
Task 1 - Subtask 1.5 - Legend Analysis
The purpose of chart legends is to associate a data series name with the graphical style used to represent it. This is critical to chart understanding when there are multiple data series represented in a single chart image.
Competing systems are expected to associate each legend label text with the corresponding graphical style element within the legend area. Bounding boxes and transcriptions (but not text roles) are given as input. Note that in this task, legend labels are not paired with the corresponding data series found in the plot area. Also, some charts do not have legends, and an empty list should be returned.
Metric
For each GT legend label, if there is an associated predicted graphical style element, we compute the IOU of the predicted BB to the GT graphical style element BB. We then divide the sum of the IOU by max(#predicted, #GT) for each image, and then average this value over all images.
For charts that have no legend, it is expected that participant systems return an empty list to receive the max score for that chart. When there is no legened, specifying any output results in a score of 0 for that chart.
Input/Output
Input: Chart Image, Chart Class, List of (Text Block BB, Text Transcription, Text Block Id)
Output: A list of (Text Block Id, Graphical Style Element BB)
Task 1 - Subtask 1.6 - Data Extraction
The goal of this task is to convert all of the previously extracted information into a CSV file. We break this task into 2 subtasks.
- Plot Element Detection/Classification
- Primary contact person
Competitor systems are expected to produce output for both sub-tasks. It is also permitted for competitors to only perform this sub-task only for certain classes of charts.
Subtask 1.6.a - Plot Element Detection/Classification
For 6a, the subtask of visual analysis, the goal is to detect and classify each individual element in the plot area. The representation of the element varies by class and is listed in the table below. Note that the output representations (BB or point) are in units of pixels.
|
Element Class
|
Description
|
Representation
|
|---|---|---|
| Bar | Individual bars in bar charts | Bounding Box |
| Line Point | Location of Data Points in line charts | Point |
| Scatter Marker | Location of Data Points in scatter charts | Point |
| Boxplot Median | Median Line of Boxplot | Point |
| Boxplot Box Top | Line that is typically the upper quartile | Point |
| Boxplot Box Bottom | Line that is typically the lower quartile | Point |
| Boxplot Top Wisker | Line that is typically the max value | Point |
| Boxplot Bottom Wisker | Line that is typically the min value | Point |
Even though boxplot elements are visually line segments, we allow for any point on that line segment. Other plot elements, such as boxplot outlier points and error bars, are not evaluated and should not be contained in the output for this sub-task. Note that the chart class is given as input to this task and that each plot element can be found in only one class of chart.
Metric
For an element to be correctly detected, it must be assigned to the correct class. We will use a variation on MSE to evaluate the representation of each element with the correct class. For each element, we compute a score between 0 and 1, where 1 represents an exact prediction, and predictions farther away than a distance threshold, T, receive a score of 0. The score is max(0, 1 - (D/T)), where D is the Euclidean distance between the predicted and GT points. The distance threshold, T, is determined to be 5% of the smallest image dimension. Because there are many ways to pair predicted and GT points, we will find the minimum cost pairing (i.e. solve this bi-partite graph matching problem).
For Boxplot elements, we will use distance between the predicted point and the line segment. For Bar chart bars, we will use the distances between corresponding BB corners.
For each chart, the scores will be summed and divided by max(#GT, #Predictions). Then these scores will be averaged across all images.
For line plots, individual lines must be segmented from each other, and will be scored similarly as lines in 6b, except the units of predicted values should be in pixels for this task.
Input/Output
Input: Outputs of tasks 1-5
Output: List of (Element Class, Element Representation)
Subtask 1.6.b - Raw Data Extraction
Output the raw data that was used to generate the chart image. For the purpose of this competition, we define a simple schema, where each chart is a set of data series, and a data series is a name (string) and a list of (x,y) points. The x values can be either numerical or string values, depending on the X-axis domain. The y values are always numerical.
For box plots, it is not necessary to reproduce the raw data as the plot only shows a statistical summary. Instead, participants are expected to recover the dataset median, upper and lower quartiles, and wisker values. The interpretation of the wiskers (e.g. dataset min/max or 2/98 percentiles) is not always contained in the chart image itself, so we do not require this information at any stage of the competition.
Metric
Data Series names should come from the chart legend (if there is one). If the data series names are not specified in the chart image, then the predicted names are ignored for evaluation purposes.
See this PDF for details
Input/Output
Input: Outputs of tasks 1-5.
Output: Set of Data Series. Data Series = (name, [(x_1, y_1), ..., (x_n, y_n)])
Task 2 - End-to-End Data Extraction
This is the main task of the competition and involves producing the CSV file directly from the chart image without any intermediate inputs. The competing systems will be evaluated on the metric for subtask 1.6.b, and are free to use third party software (e.g. for OCR).
Metric
See Metric for sub-task 1.6.b.
Input/Output
Input: Chart Image.
Output: See output of sub-task 1.6.b.
Task 3 - Visual Question Answering
Given an input chart image and a question about the chart in the image, participants must provide an answer to the given question. The answers can be textual or numeric. There are different types of questions, and while the simpler ones can be answered through classification, other more complicated ones will require reasoning over the chart structure and might even require some computations. Some questions might even require a set of ordered or unordered strings as outputs.
In the first inclusion of this task in our competition, we will use questions based on templates. For each chart, the answer of the applicable question template are generated by referring to existing annotations for the chart data extraction Sub-tasks (1.1 to 1.6).
Metric
We will use the accuracy metric as defined by Methani et alia. We consider a textual answer correct if the ground truth and output exactly match each other. For numeric answers produced by regression, we will consider them correct if the output is within 5% of the ground truth answer. We will average the score across all the question-answer pairs of the test set to get the final accuracy.
Input/Output
Input: Chart Image, Question text
Output: Answer (number, one string, multiple strings)